Blog Archives
NetApp SPECSfs record broken in 13 days
Thanks for my buddy, Chew Boon of HDS who put me on alert about the new leader of the SPECSfs benchmark results. NetApp “world record” has been broken 13 days later by Avere Systems.
Avere has posted the result of 1,564,404 NFS ops/sec with an ORT (overall response time) of 0.99 msec. This benchmark was done by 44 nodes, using 6.808 TB of memory, with 800 HDDs.
Earlier this month, NetApp touted fantastic results and quickly came out with a TR comparing their solution with EMC Isilon. Here’s a table of the comparison
But those numbers are quickly made irrelevant by Avere FXT, and Avere claims to have the world record title with the “smallest footprint ever”. Here’s a comparison in Avere’s blog, with some photos to boot.
For the details of the benchmark, click here. And the news from PR Newswire.
If you have not heard of Avere, they are basically the core team of Spinnaker. NetApp acquired Spinnaker in 2003 to create the clustered file systems from the Spinnaker technology. The development and integration of Spinnaker into NetApp’s Data ONTAP took years and was buggy, and this gave the legroom for competitors like Isilon to take market share in the clustered NAS/scale-out NAS landscape.
Meanwhile, NetApp finally came did come good with the Spinnaker technology and with ONTAP 8.0.1 and 8.1, the codes of both platforms merged into one.
The Spinnaker team went on develop a new technology called the “A-3 Architecture” (shown below) and positioned itself as a NAS Accelerator.
![]()
The company has 2 series of funding and now has a high performance systems to compete with the big boys. The name, Avere Systems, is still pretty much unknown in this part of the world and this “world record” will help position them stronger.
But as I have said before, benchmarking are just ways to have bigger bragging rights. It is a game of leapfrogging, and pretty soon this Avere record will be broken. It is nice while it lasts.
Performance benchmarks – the games that we play
First of all, congratulations to NetApp for beating EMC Isilon in the latest SPECSfs2008 benchmark for NFS IOPS. The news is everywhere and here’s one here.
EMC Isilon was blowing its horns several months ago when it hit 1,112,705 IOPS recorded from a 140-node S200 cluster with 3,360 disk drives and a overall response time of 2.54 msecs. Last week, NetApp became top dog, pounding its chest with 1,512,784 IOPS on a 24 x FAS6240 nodes with an overall response time of 1.53msecs. There were 1,728 450GB, 15,000rpm disk drives and the FAS6240s were fitted with Flash Cache.
And with each benchmark that you and I have seen before and after, we will see every storage vendors trying to best the other and if they did, their horns will be blaring, the fireworks are out and they will pounding their chests like Tarzan, saying “Who’s your daddy?” The euphoria usually doesn’t last long as performance records are broken all the time.
However, the performance benchmark results are not to be taken in verbatim because they are not true representations of real life, production environment. 2 years ago, the magazine, the defunct Byte and Switch (which now is part of Network Computing), did a 9-year study on File Systems and Storage Benchmarking. In a very interesting manner, it revealed that a lot of times, benchmarks results are merely reduced to single graphs which has little information about the details of how the benchmark was conducted, how long the benchmark took and so on.
The paper, published by Avishay Traeger and Erez Zadok from Stony Brook University and Nikolai Joukov and Charles P. Wright from the IBM T.J. Watson Research Center entitled, “A Nine Year Study of File System and Storage Benchmarking” studied 415 file systems from 106 published results and the article quoted:
Based on this examination the paper makes some very interesting observations and
conclusions that are, in many ways, very critical of the way “research” papers have
been written about storage and file systems.
Therefore, the paper highlighted the way the benchmark was done and the way the benchmark results were reported and judging by the strong title (It was titled “Lies, Damn Lies and File Systems Benchmarks”) of the online article that reviewed the study, benchmarks are not the pictures that says a thousand words.
Be it TPC-C, SPC1 or SPECSfs benchmarks, I have gone through some interesting experiences myself, and there are certain tricks of the trade, just like in a magic show. Some of the very common ones I come across are
- Short stroking – a method to format a drive so that only the outer sectors of the disk platter are used to store data. This practice is done in I/O-intensive environments to increase performance.
- Shortened test – performance tests that run for several minutes to achieve the numbers rather than prolonged periods (which mimics real life)
- Reporting aggregated numbers – Note the number of nodes or controllers used to achieve the numbers. It is not ONE controller than can achieve the numbers, but an aggregated performance results factored by the number of controllers
NFS deserves more credit from guys doing virtualization
I was at the RedHat Forum last week when I chanced upon a conversation between an attendee and one of the ECS engineers. The conversation went like this
Attendee: Is the RHEV running on SAN or NAS?
ECS Engineer: Oh, for this demo, it is running NFS but in production, you should run iSCSI or Fibre Channel. NFS is only for labs only, not good for production.
Attendee: I see … (and he went off)
I was standing next to them munching my mini-pizza and in my mind, “Oh, come on, NFS is better than that!”
NAS has always played a smaller brother to SAN but usually for the wrong reasons. Perhaps it is the perception that NAS is low-end and not good enough for high-end production systems. However, this is very wrong because NAS has been growing at a faster rate than Fibre Channel, and at the same time Fibre Channel growth has been tapering and possibly on the wane. And I have always said that NAS is a better suited protocol when it comes to unstructured data and files because the NAS protocol is the new storage networking currency of Internet storage and the Cloud (this could change very soon with the REST protocol, but that’s another story). Where else can you find a protocol where sharing is key. iSCSI, even though it has been growing at a faster pace in production storage, cannot be shared easily because it is block-based.
Now back to NFS. NFS version 3 has been around for more than 15 years and has taken its share of bad raps. I agree that this protocol is still very much in the landscape of most NFS installations. But NFS version 4 is changing all that taking on the better parts of the CIFS protocol, notably the equivalent of opportunistic locking or oplocks. In addition to that it has greatly enhanced its security, incorporating Kerberos-type of authentication. As for performance, NFS v4 added in a compounded in a COMPOUND operations for aggregating operations into a single request.
Today, most virtualization solutions from VMware and RedHat works with NFS natively. Note that the Windows CIFS protocol is not supported, only NFS.
This blog entry is not stating that NFS is better than iSCSI or FC but to give NFS credit where credit is due. NFS is not inferior to these block-based protocols. In fact, there are situations where NFS is better, like for instance, expanding the NFS-based datastore on the fly in a VMware implementation. I will use several performance related examples since performance is often used as a yardstick when these protocols are compared.
In an experiment conducted by VMware based on a version 4.0, with all things being equal, below is a series of graphs that compares these 3 protocols (NFS, iSCSI and FC). Note the comparison between NFS and iSCSI rather than FC because NFS and iSCSI run on Gigabit Ethernet, whereas FC is on a different networking platform (hey, if you got the money, go ahead and buy FC!)
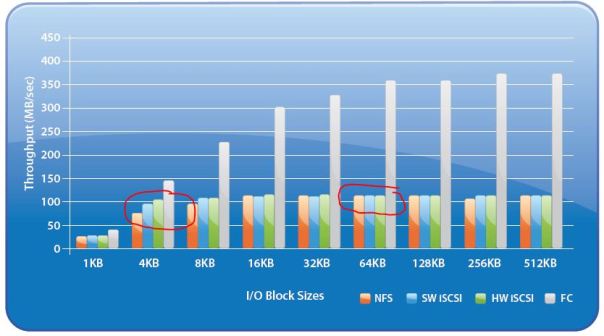
Based a one virtual machine (VM), the Read throughput statistics (higher is better) are:
The red circle shows that NFS is up there with iSCSI in terms of read throughput from 4K blocks to 512K blocks. As for write throughput for 1 VM, the graph is shown below:

Even though NFS suffers in write throughput in the smaller blocks less than 16KB, NFS performance write throughput improves over iSCSI when between 16K and 32K range and is equal when it is in 64K, 128K and 512K block tests.
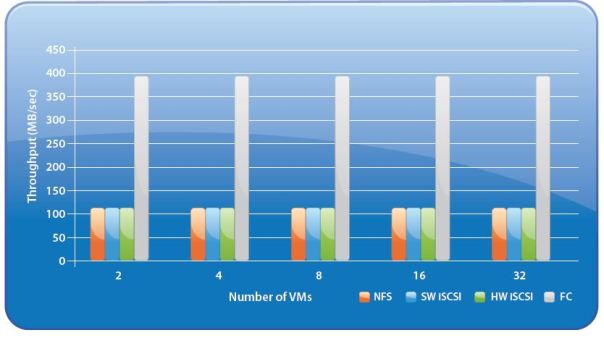
The 2 graphs above are of a single VM. But in most real production environment, a single ESX host will run multiple VMs and here is the throughput graph for multiple VMs.

Again, you can see that in a multiple VMs environment, NFS and iSCSI are equal in throughput, dispelling the notion that NFS is not as good in performance as iSCSI.
Oh, you might say that this is just VMs without any OSes or any applications running in these VMs. Next, I want to share with you another performance testing conducted by VMware for an Microsoft Exchange environment.
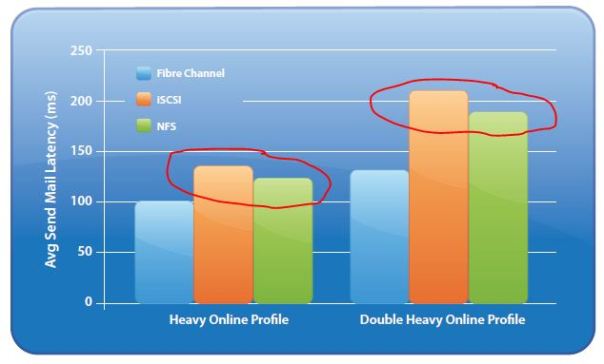
The next statistics are produced from an Exchange Load Generator (popularly known as LoadGen) to simulate the load of 16,000 Exchange users running in 8 VMs. With all things being equal again, you will be surprised after you see these graphs.
 The graph above shows the average send mail latency of the 3 protocols (lower is better). On the average, NFS has lower latency than iSCSI, better than what most people might think. Another graph shows the 95th percentile of send mail latency below:
Again, you can see that the NFS’s latency is lower than iSCSI. Interesting isn’t it?
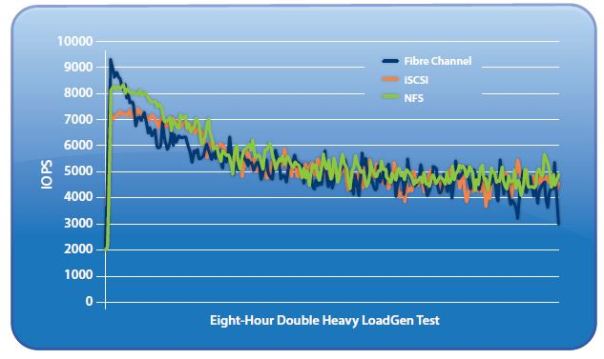
What about IOPS then? In another test with an 8-hour DoubleHeavy LoadGen simulator, the IOPS graphs for all 3 protocols are shown below:
 In the graph above (higher is better), NFS performed reasonably well compared to the other 2 block-based protocols, and even outperforming iSCSI in this 8-hour load testing. Surprising huh?
As I have shown, NFS is not inferior compared to the block-based protocols such as iSCSI. In fact, VMware in version 4.1 has improved all 3 storage protocols significantly as mentioned in the VMware paper. The following are quoted in the paper for NFS and iSCSI.
- Using storage microbenchmarks, we observe that vSphere 4.1 NFS shows improvements in the range of 12–40% for Reads,and improvements in the range of 32–124% for Writes, over 10GbE.
- Using storage microbenchmarks, we observe that vSphere 4.1 Software iSCSI shows improvements in the range of 6–23% for Reads, and improvements in the range of 8–19% for Writes, over 10GbE
The performance improvement for NFS is significant when the network infrastructure was 10GbE. The percentage jump between 32-124%! That’s a whopping figure compared to iSCSI which ranged from 8-19%. Since both protocols are neck-to-neck in version 4.0, NFS seems to be taking a bigger lead in version 4.1. With the release of VMware version 5.0 a few weeks ago, we shall know the performance of both NFS and iSCSI soon.
To be fair, NFS does take a higher CPU performance hit compared to iSCSI as the graph below shows:
 Also note that the load testing are based on NFS version 3. If version 4 was used, I am sure the performance statistics above will take a whole new plateau.
Therefore, NFS isn’t inferior at all compared to iSCSI, even in a 10GbE environment. We just got to know the facts instead of brushing off NFS.


